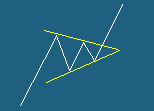
- Pattern Type : Symmetrical Triangle
bullish
- Expectations : Trend Continuation if the stock
price breaks or gaps above the resistance line
(top trend line).
- Description : Stock prices run between two trend
lines that approach each other. The trend lines
slopes are almost perfectly opposite to each
other.
|
 |
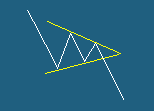
- Pattern Type : Symmetrical Triangle
bearish
- Expectations : Trend Continuation if the stock
price breaks or gaps below the support line
(bottom trend line).
- Description : Stock prices run between two trend
lines that approach each other. The trend lines
slope are almost perfectly opposite to each
other.
|
 |
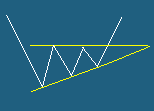
- Pattern Type : Rising (ascending)
Triangle bullish
- Expectations : Trend Reversal if the stock price
breaks or gaps above the resistance trend line
(top trend line).
- Description : Stock prices run between two trend
lines that approach each other. The resistance
trend line slope is normally fairly flat.
|
 |
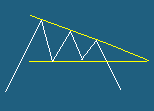
- Pattern Type : Falling (descending)
Triangle bearish
- Expectations : Trend Reversal if the stock price
breaks or gaps below the support line (bottom
trend line).
- Description : Stock prices run between two trend
lines that approach each other. The support trend
line slope is normally fairly flat.
|
 |

