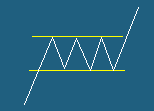
- Pattern Type : Horizontal Channel bullish
- Expectations : Trend Continuation if the stock
price breaks or gaps above the resistance line
(top trend line).
- Description : Stock prices run between two evenly
spaced trend lines over a period of weeks. The
trend lines can be sloping in a pattern like this
but not steeply.
|
 |
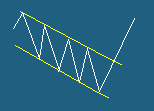
- Pattern Type : Down Channel
- Expectations : Trend Reversal if the stock price
breaks or gaps above the resistance line (top
trend line).
- Description : Stock prices run between two evenly
spaced trend
lines over a period of weeks. The trend lines
slope down fairly steeply.
|
 |
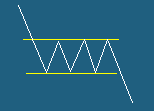
- Pattern Type : Horizontal Channel bearish
- Expectations : Trend Continuation if the stock
price breaks or gaps below the support line
(bottom trend line).
- Description : Stock prices run between two evenly
spaced trend lines over a period of weeks. The
trend lines can be sloping in a pattern like this
but not steeply.
|
 |
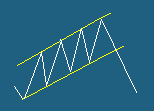
- Pattern Type : Up Channel bearish
- Expectations : Trend Reversal if the stock price
breaks or gaps below the support line (bottom
trend line).
- Description : Stock prices run between two evenly
spaced trend lines over a period of weeks. The
trend lines slope up fairly steeply.
|
 |